We bought two boxes that were supposed to be identical. Eight H100s each, same rack, same image. On one of them a tensor-parallel serve of Llama-3-70B did about 3,000 tokens a second. On the other it did 900, with every GPU pinned at high utilization the whole time. Same model, same code, same card count. The difference was a PCIe switch and a BIOS setting nobody had checked, and it took most of a day to find because every dashboard said both boxes were healthy.
That's the thing about a multi-GPU box. It looks like a bag of eight GPUs. It behaves like a small, opinionated network, and the wiring between the cards matters more than the cards. This is part 2 of the series. Part 1 was the twelve-layer stack under a single GPU pod. This one stays inside one chassis: how the GPUs talk, how to read the topology, why NCCL is slow, and how a 70B model actually lands on the hardware. Part 3 leaves the box.
the box is a network, not a bag of GPUs
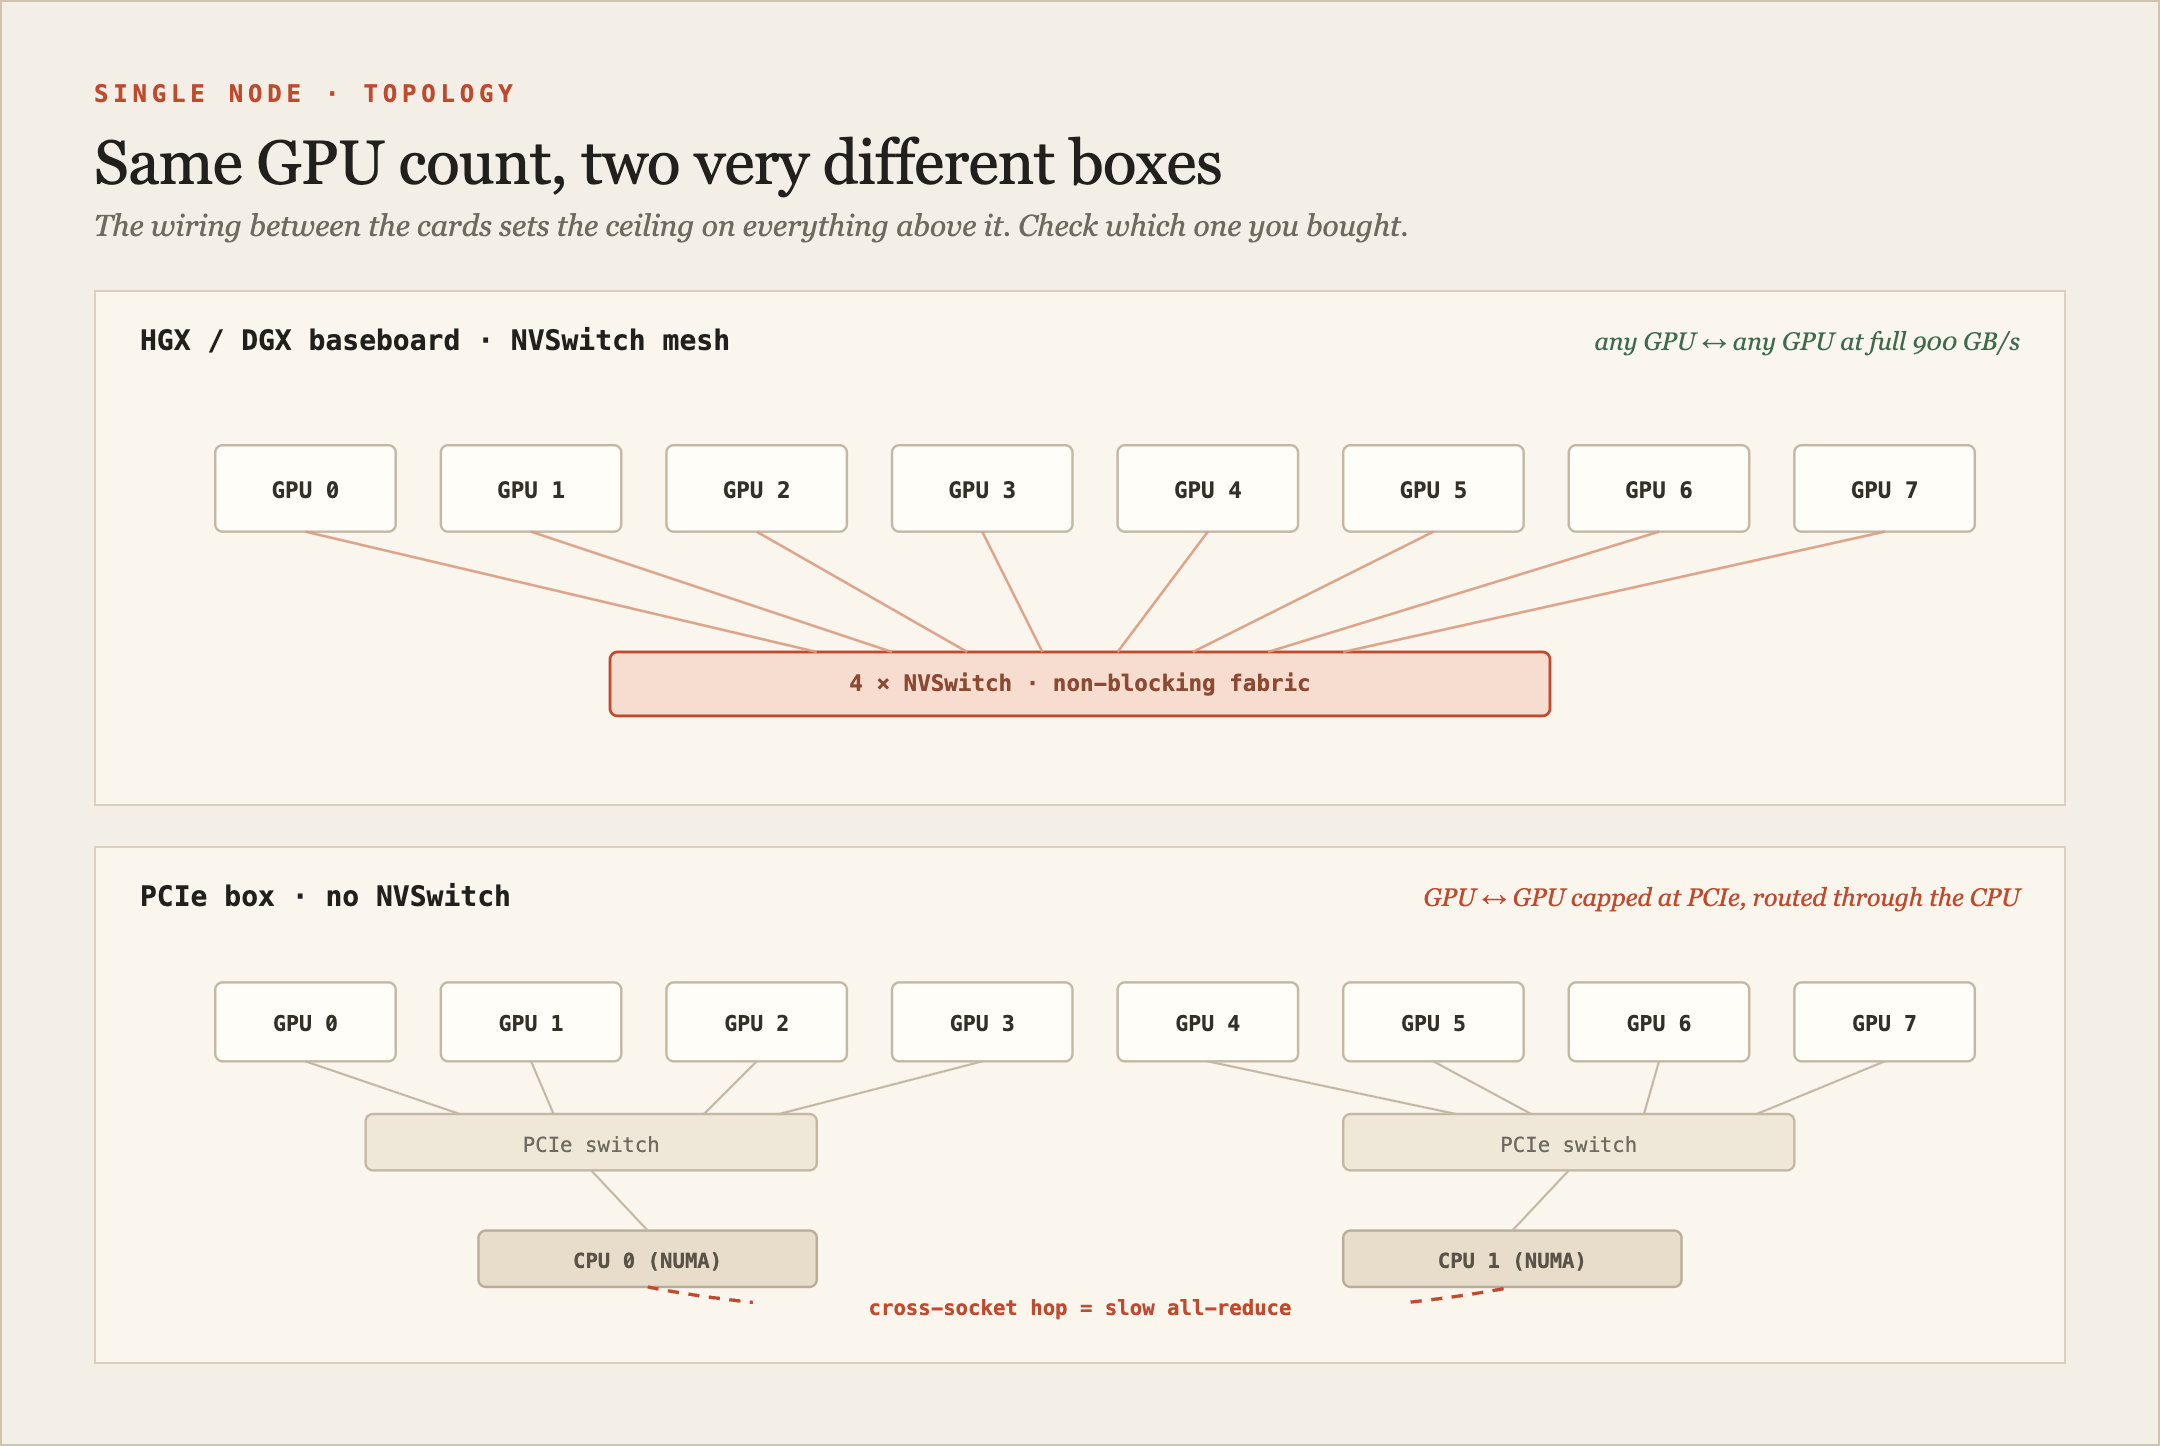
The first question about any multi-GPU server is how the GPUs are wired, because that sets a hard ceiling on everything above it. There are two very different animals sold as "8-GPU servers."
An HGX or DGX baseboard wires all eight GPUs through a bank of NVSwitches. Every GPU reaches every other GPU at the full NVLink rate, non-blocking. On H100 and H200 that's NVLink 4 at 900 GB/s per GPU. On B200 it's NVLink 5 at 1.8 TB/s. That flat, full-bandwidth mesh is the reason you can split a model eight ways and have the halves talk fast enough to keep up.
A cheaper "8x PCIe" box has no NVSwitch. The GPUs hang off PCIe switches and the CPU root complexes, and GPU-to-GPU traffic crawls through PCIe, often routed up through the CPU. PCIe Gen5 x16 is about 128 GB/s, Gen4 about 64. NVLink 4 is roughly seven times faster than Gen5 and fourteen times faster than Gen4. That gap is the entire reason tensor parallelism cares about your topology. The two "identical" boxes in the opening weren't identical: one had the NVSwitch mesh, the other routed two of its GPU pairs across a PCIe switch with a BIOS feature quietly strangling them.
One units trap that trips up everyone reading spec sheets: NVIDIA quotes NVLink bandwidth bidirectionally. A100's "600 GB/s" is 300 each way. Pick a convention, state it once, and don't compare someone's unidirectional number to your bidirectional one.
Key Insight: Two servers with the same eight GPUs can differ by 3× on the same job. Before you promise a throughput number, run nvidia-smi topo -m and confirm the GPUs talk over NVLink (the NV-prefixed rows), not over PCIe routed through the CPU (the SYS rows).
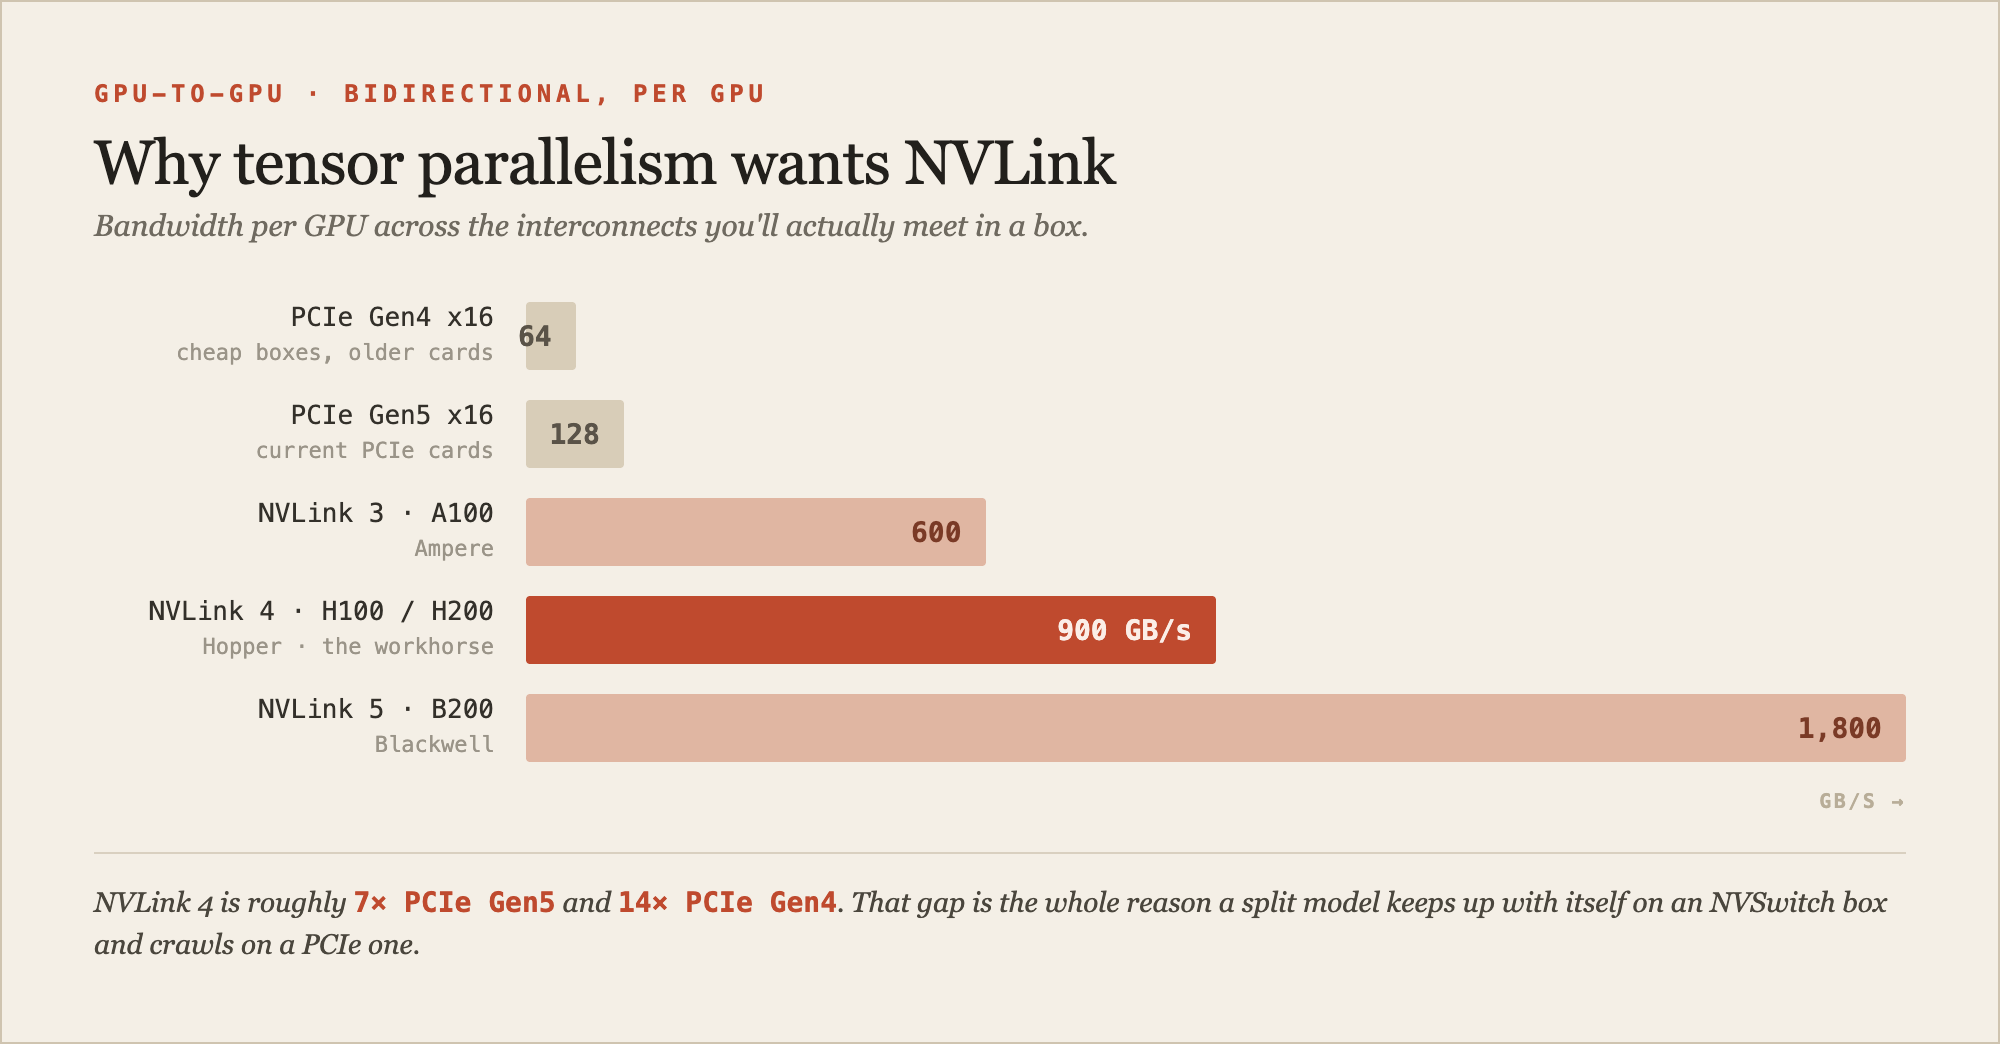
Fig. 2 · bandwidth per GPU across the interconnects you'll actually meet. The jump from PCIe to NVLink is the one that decides whether a split model keeps up with itself.
reading nvidia-smi topo -m
You don't have to guess at any of this. nvidia-smi topo -m prints the whole connection matrix, and learning to read it is the single most useful GPU-ops skill after nvidia-smi itself. Every cell tells you how one GPU reaches another, and the symbols form a quality ladder from best to worst:
NV#: connected by # bonded NVLinks. Best.NV18means eighteen links, full H100 mesh.PIX: a single PCIe bridge, same switch. Fine.PXB: multiple PCIe bridges, but not across the CPU host bridge.PHB: crosses a PCIe host bridge, through the CPU, same NUMA node.NODE: crosses host bridges within a NUMA node.SYS: crosses the inter-socket link between CPUs. Worst. This is CPU-to-CPU-to-GPU.
If the GPUs in your tensor-parallel group show NV18 to each other, you're golden. If any pair shows SYS, your collective operations are dragging across the socket interconnect and you've found your 900-tokens-a-second box. The same matrix has a column for GPU-to-NIC affinity, which matters enormously for the multi-node story in part 3: you want the NIC on the same PCIe complex as the GPU it feeds.
NCCL picks a road
Every framework that splits work across GPUs (PyTorch DDP and FSDP, DeepSpeed, Megatron, the tensor-parallel path in vLLM) does its cross-GPU communication through NCCL, NVIDIA's collectives library. NCCL is where "the GPUs need to agree on a number" turns into actual bytes on actual wires, and it auto-picks the road.
Inside one box it prefers, in order: peer-to-peer over NVLink (best), peer-to-peer over PCIe, shared host memory (staged through RAM), then network sockets (worst, and a sign something's misconfigured). When an all-reduce (the step where every GPU merges its numbers with all the others and ends up with the combined result) is slow, the debugging loop is almost always the same handful of moves:
# 1. what did NCCL actually choose?
NCCL_DEBUG=INFO python train.py 2>&1 | grep -iE 'via|transport|channel'
#   "via P2P/direct pointer" = good. "via SHM" or "via NET/Socket" intra-node = bad.

# 2. confirm the GPUs are NVLinked, not routed over SYS
nvidia-smi topo -m

# 3. benchmark against the ceiling
all_reduce_perf -b 8 -e 4G -f 2 -g 8   # from nccl-tests

# 4. if a hang clears when you disable P2P, you have an ACS/IOMMU problem
NCCL_P2P_DISABLE=1 python train.py
The env vars worth knowing are few. NCCL_DEBUG=INFO tells you what topology and transport NCCL chose. NCCL_P2P_LEVEL and NCCL_P2P_DISABLE control peer-to-peer. NCCL_SOCKET_IFNAME picks the bootstrap interface, and pointing it at the wrong one (lo, docker0) is a classic way to make init hang. NCCL_TOPO_FILE lets you hand NCCL a topology description, which you sometimes need on cloud VMs because virtualized PCI hides the real affinity and NCCL guesses wrong. On a healthy 8-GPU NVSwitch box you usually touch none of these and it just works. The trouble starts on anything cheaper or virtualized.
the invisible tax: NUMA and ACS
Two settings below the framework quietly decide whether your bandwidth numbers are real, and neither shows up in a GPU dashboard.
The first is NUMA pinning. A multi-socket server splits its PCIe lanes and RAM between CPU sockets, and each GPU is physically wired to one socket. Run your process on socket 0 while it drives a GPU hung off socket 1, and every host-to-device copy crosses the inter-socket link. NCCL's low-latency protocol stages data through a pinned CPU buffer, so this hits communication, not just data loading. The fix is a one-liner: numactl --cpunodebind=0 --membind=0 <cmd>, matched to the socket that owns the GPU. nvidia-smi topo -m prints the affinity so you know which socket that is. It's genuinely deflating to spend an afternoon profiling and find the answer was a numactl prefix, but that's most of this job.
The second is PCIe ACS, Access Control Services, and it's the one that cost us most of that day. ACS forces PCIe peer-to-peer transactions to route up through the CPU root complex so the platform can police them. That defeats direct GPU-to-GPU DMA across a PCIe switch: latency climbs, throughput collapses, and NCCL can hang outright. ACS has to be off for peer-to-peer to work across a switch. You check it with lspci -vvv | grep -i acsctl and disable it in BIOS or with a setpci loop over the bridges. Its cousin, the IOMMU, does the same routing-through-the-root-complex thing, which is exactly why passthrough GPUs on cloud VMs often show degraded peer-to-peer: the isolation that makes virtualization safe is the isolation that makes GPUDirect slow. If nvidia-smi insists your GPUs "are not P2P capable," the shortlist is ACS enabled, IOMMU on, consumer cards, or GPUs on different root complexes. p2pBandwidthLatencyTest from the CUDA samples confirms which.
fitting a 70B model on the box
The practical question most teams actually have is: how many GPUs does my model need, and how do I split it. Tensor parallelism splits every layer's weight matrices across GPUs, which means every token, at every layer, triggers a collective to recombine the partial results. That makes TP communication-bound and latency-sensitive, which is the real reason it wants NVLink. On a PCIe-only box, tensor parallelism is frequently slower than just pipelining the layers, and vLLM's own guidance says as much: no NVLink, prefer --pipeline-parallel-size over --tensor-parallel-size.
The memory math for Llama-3-70B is a worked example worth carrying around:
- Weights: 70B params times 2 bytes for BF16 is about 140 GB. That already doesn't fit on one 80GB card.
- KV cache (the model's running memory of the tokens it has already processed): roughly 2.5 GB per sequence at 8K context, climbing to tens of GB at 128K. This is what eats whatever VRAM the weights left behind and sets your max batch size.
- Real footprint with activations and framework overhead lands north of 200 GB.
So Llama-3-70B at BF16 wants two H100 80GB cards (--tensor-parallel-size 2), or four A100 40GB, or a fistful of 24GB cards. Tensor parallelism splits the KV cache too, so two GPUs buys you roughly double the batch headroom, not just room for the weights. Quantize to FP8 on Hopper or Blackwell, or INT4 with AWQ, and the weights roughly halve or quarter, which can drop a 70B onto a single card at some quality cost. You can quantize the KV cache too (--kv-cache-dtype=fp8_e5m2), which shrinks the biggest consumer of leftover VRAM once batch sizes climb. And a rule worth internalizing: tensor-parallel a model only when it genuinely doesn't fit one GPU. For a model that does fit, run several replicas at --tensor-parallel-size 1 instead, because TP's per-layer communication is pure overhead you're paying for nothing when one card already holds the whole model. The constraint people forget: your TP size has to divide the number of attention heads evenly, so you don't get to pick arbitrary GPU counts, and on Kubernetes it also has to equal the pod's nvidia.com/gpu limit or the server won't start. (You learn this the moment --tensor-parallel-size 6 refuses to start and the error message does nothing to help.)
the caveats that page you
Dense GPU boxes fail in ways that a single card never does, and most of them present as "one GPU is a little slow" rather than a clean error.
Thermal throttling is first. Eight cards share airflow, and a fully loaded chassis runs hot. Data-center GPUs start clocking down before about 85°C, and nvidia-smi --query-gpu=clocks_throttle_reasons.active will tell you whether it's a software thermal slowdown, a hardware one, or a power cap. Power capping is the sibling: nvidia-smi -pl sets a limit below the card's TDP (700W on an H100 SXM), and a rack without enough power budget will cap every card and slow the whole box uniformly.
Then the straggler problem, which is the nastiest because it hides. Collective operations synchronize every step, so the slowest GPU sets the pace for all of them. One card that's throttling, power-capped, or quietly degraded drags the entire tensor-parallel group, and the symptom is maddening: every GPU shows high utilization, throughput is low, and nothing errors. You find it by looking at per-GPU clocks and temperature and hunting the outlier.
The rest of the list is worth a scan before you sign off on a box:
- PCIe lane starvation. A card silently negotiating Gen3 x4 instead of Gen5 x16 is pure mystery slowness.
lspci -vvshows the negotiatedLnkSta. - NVLink errors.
nvidia-smi nvlink -eshows CRC and replay counters. Rising counts mean a flaky link or cable and degraded bandwidth. - Oversubscribed PCIe switch. Cheap boxes put several GPUs behind one switch uplink, and they contend for it.
- The
/dev/shmtrap, if you're on Kubernetes. NCCL stages some intra-node transfers through shared memory, and a container's default 64 MiB/dev/shmhangs multi-GPU serving with no useful error. Mount anemptyDirwithmedium: Memoryat/dev/shm. It's in every production vLLM manifest, and it's why tensor-parallel works on a bare VM but hangs in a pod. - Xid 79, the "fell off the bus" from part 1, shows up here too when a card overheats or loses power delivery under a full load it never saw in acceptance testing.
picking an inference engine
If the box is for serving rather than training, the engine choice matters, and by 2026 the field has settled. All the live engines converge on the same two tricks: continuous batching (decide the batch membership every decode step so the GPU never idles on the slowest request) and paged KV cache (manage the cache like OS virtual memory so you don't waste most of your VRAM on fragmentation). The differences are in the scheduler and the compile strategy.
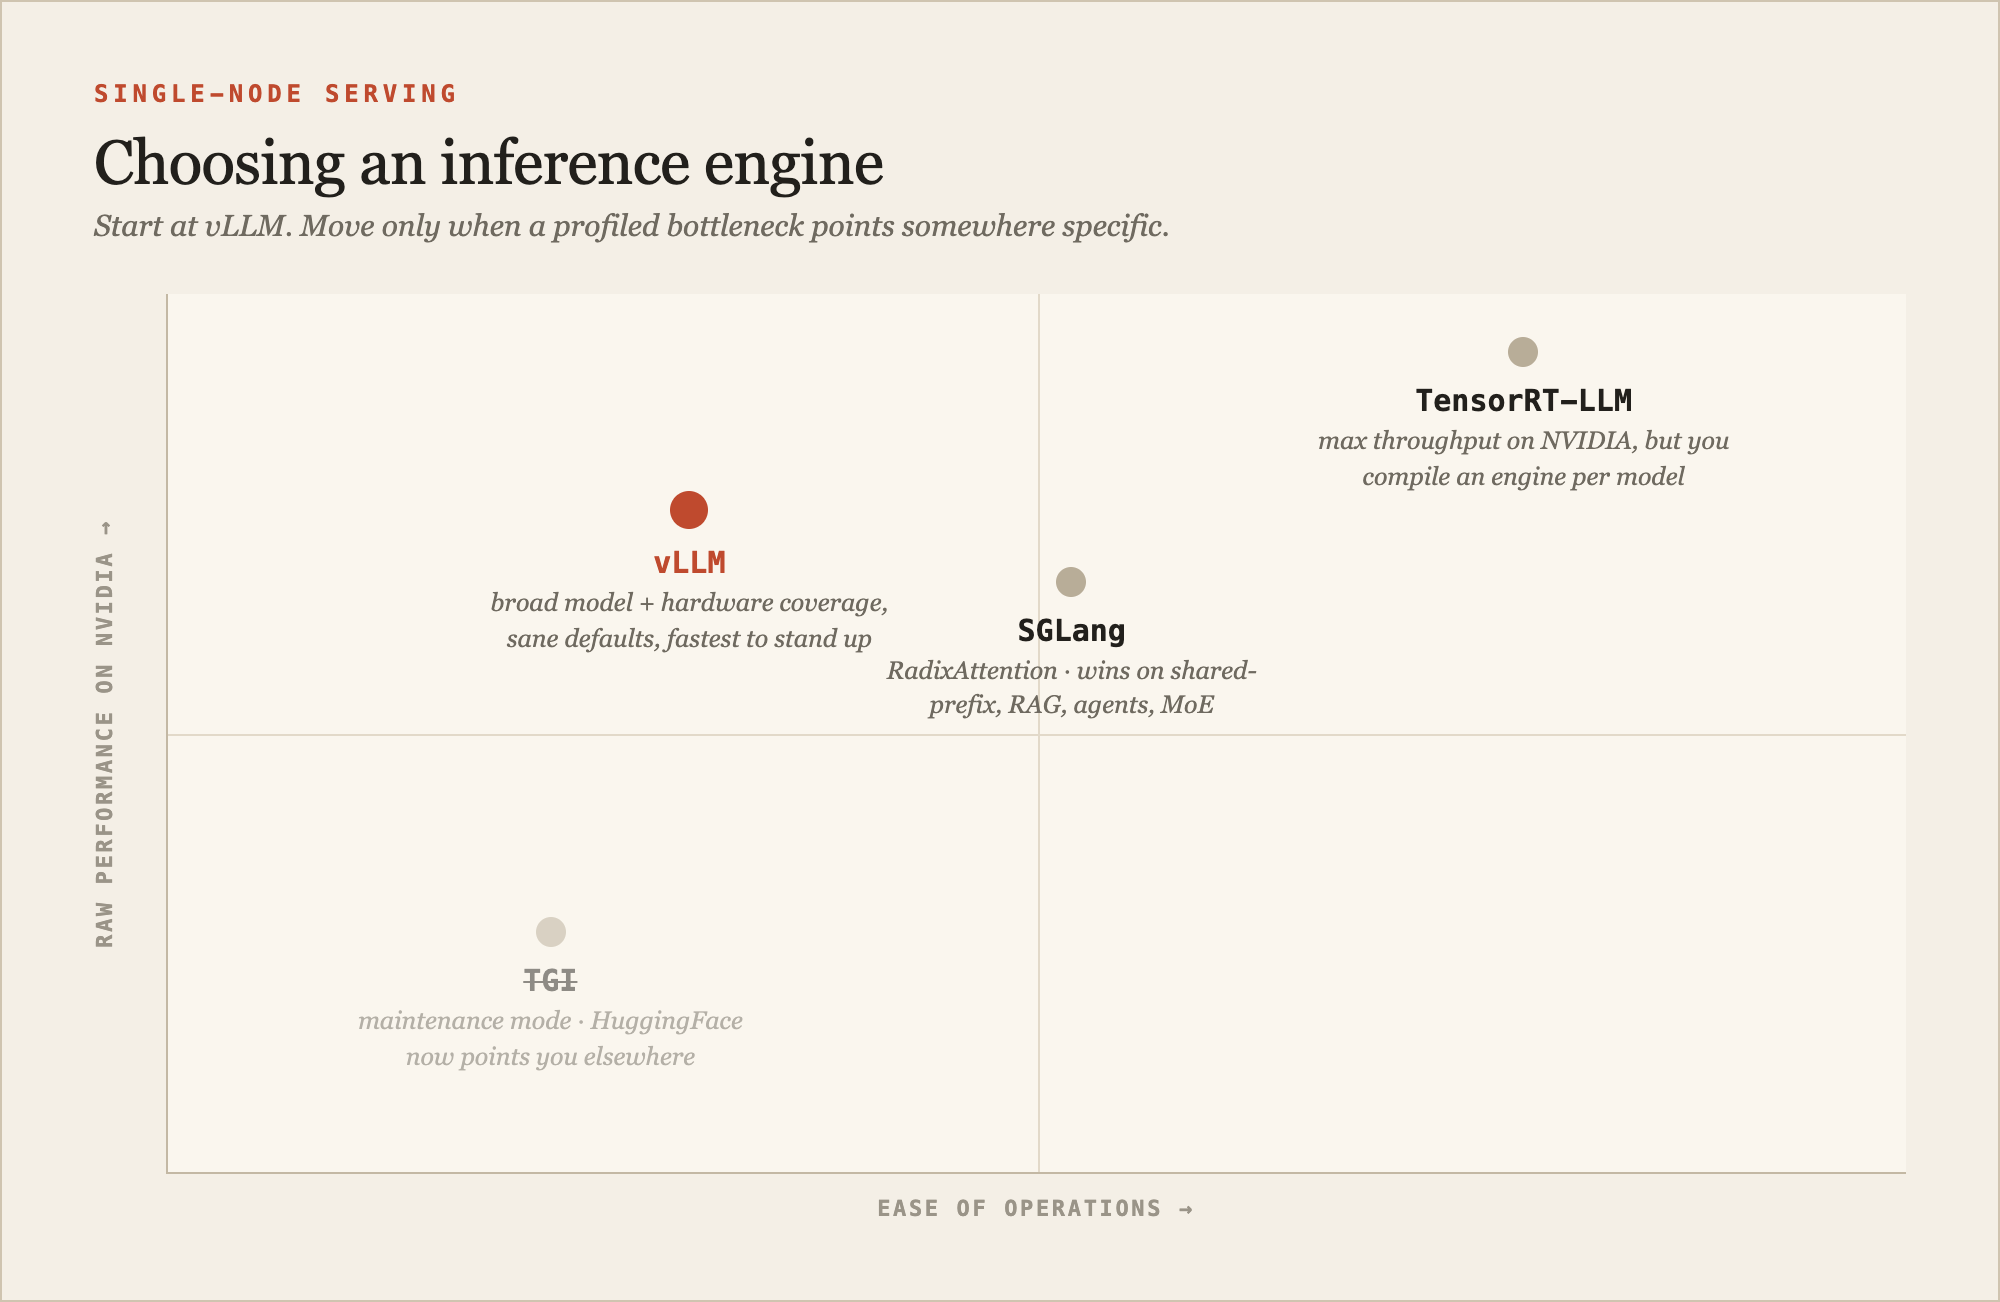
Fig. 3 · where the four engines land. Start at vLLM; move only when a profiled bottleneck points somewhere specific.
Start with vLLM. It has the broadest model and hardware coverage, it invented PagedAttention, and it stands up with sane defaults faster than anything else. Reach for TensorRT-LLM when a profiled bottleneck justifies the cost, because it delivers the highest raw throughput and lowest latency on NVIDIA hardware but makes you compile a per-model, per-GPU engine and run a heavier ops burden for it. Reach for SGLang when your workload shares prefixes: RAG, multi-turn chat, agents, or high-concurrency MoE, where its RadixAttention prefix cache pulls meaningfully ahead. And don't start new work on TGI; HuggingFace put it in maintenance mode and points people at vLLM or SGLang themselves. One layer up from the engine, NVIDIA's Dynamo wraps any of these for distributed, disaggregated serving with a KV-cache-aware router, and NIM packages them as prebuilt microservices. On a single box the raw engine is what you're tuning, but those are the names you'll meet the moment you scale out.
The two boxes from the opening ran the same vLLM. Same engine, same flags, one served three times the traffic. The engine was never the variable. The wires were. Which is the whole lesson of a single node, and also the reason part 3 is about the wires between nodes, where the same story plays out at a hundred times the scale and a hundred times the cost.