The pod was stuck in Pending and the node had eight H100s sitting idle. kubectl describe node said nvidia.com/gpu: 0. nvidia-smi on the host printed all eight cards, healthy, 40°C, nothing running. So the hardware was fine, the driver was fine, and Kubernetes was convinced there were zero GPUs in a box that cost more than my car.
That gap is the whole job. A GPU pod doesn't run on a GPU. It runs on about a dozen layers stacked between the silicon and your container, and any one of them can be quietly broken while every layer above and below it looks green. If you've shipped normal apps on Kubernetes, a GPU pod looks identical right up until it doesn't: underneath sits a stack of hardware and driver pieces a web pod never touches, and that's where the surprises live. This series is about running those layers in production without getting paged. Part 1 is the anatomy: what the layers are, what breaks at each one, and which numbers actually tell you the truth. Part 2 is a single box with eight GPUs and the wires between them. Part 3 is scaling past one box, where the network becomes the machine. Part 4 is watching the whole thing under real traffic, part 5 is scaling it to zero when nobody's using it without the bill or the cold start eating you, part 6 is the routing layer in front of it all, where the right load balancer buys a 2× speedup for free, part 7 keeps it breathing through loads and deploys, and part 8 is sharing it with other teams without the tenants, or a security boundary that isn't where you think, burning you.
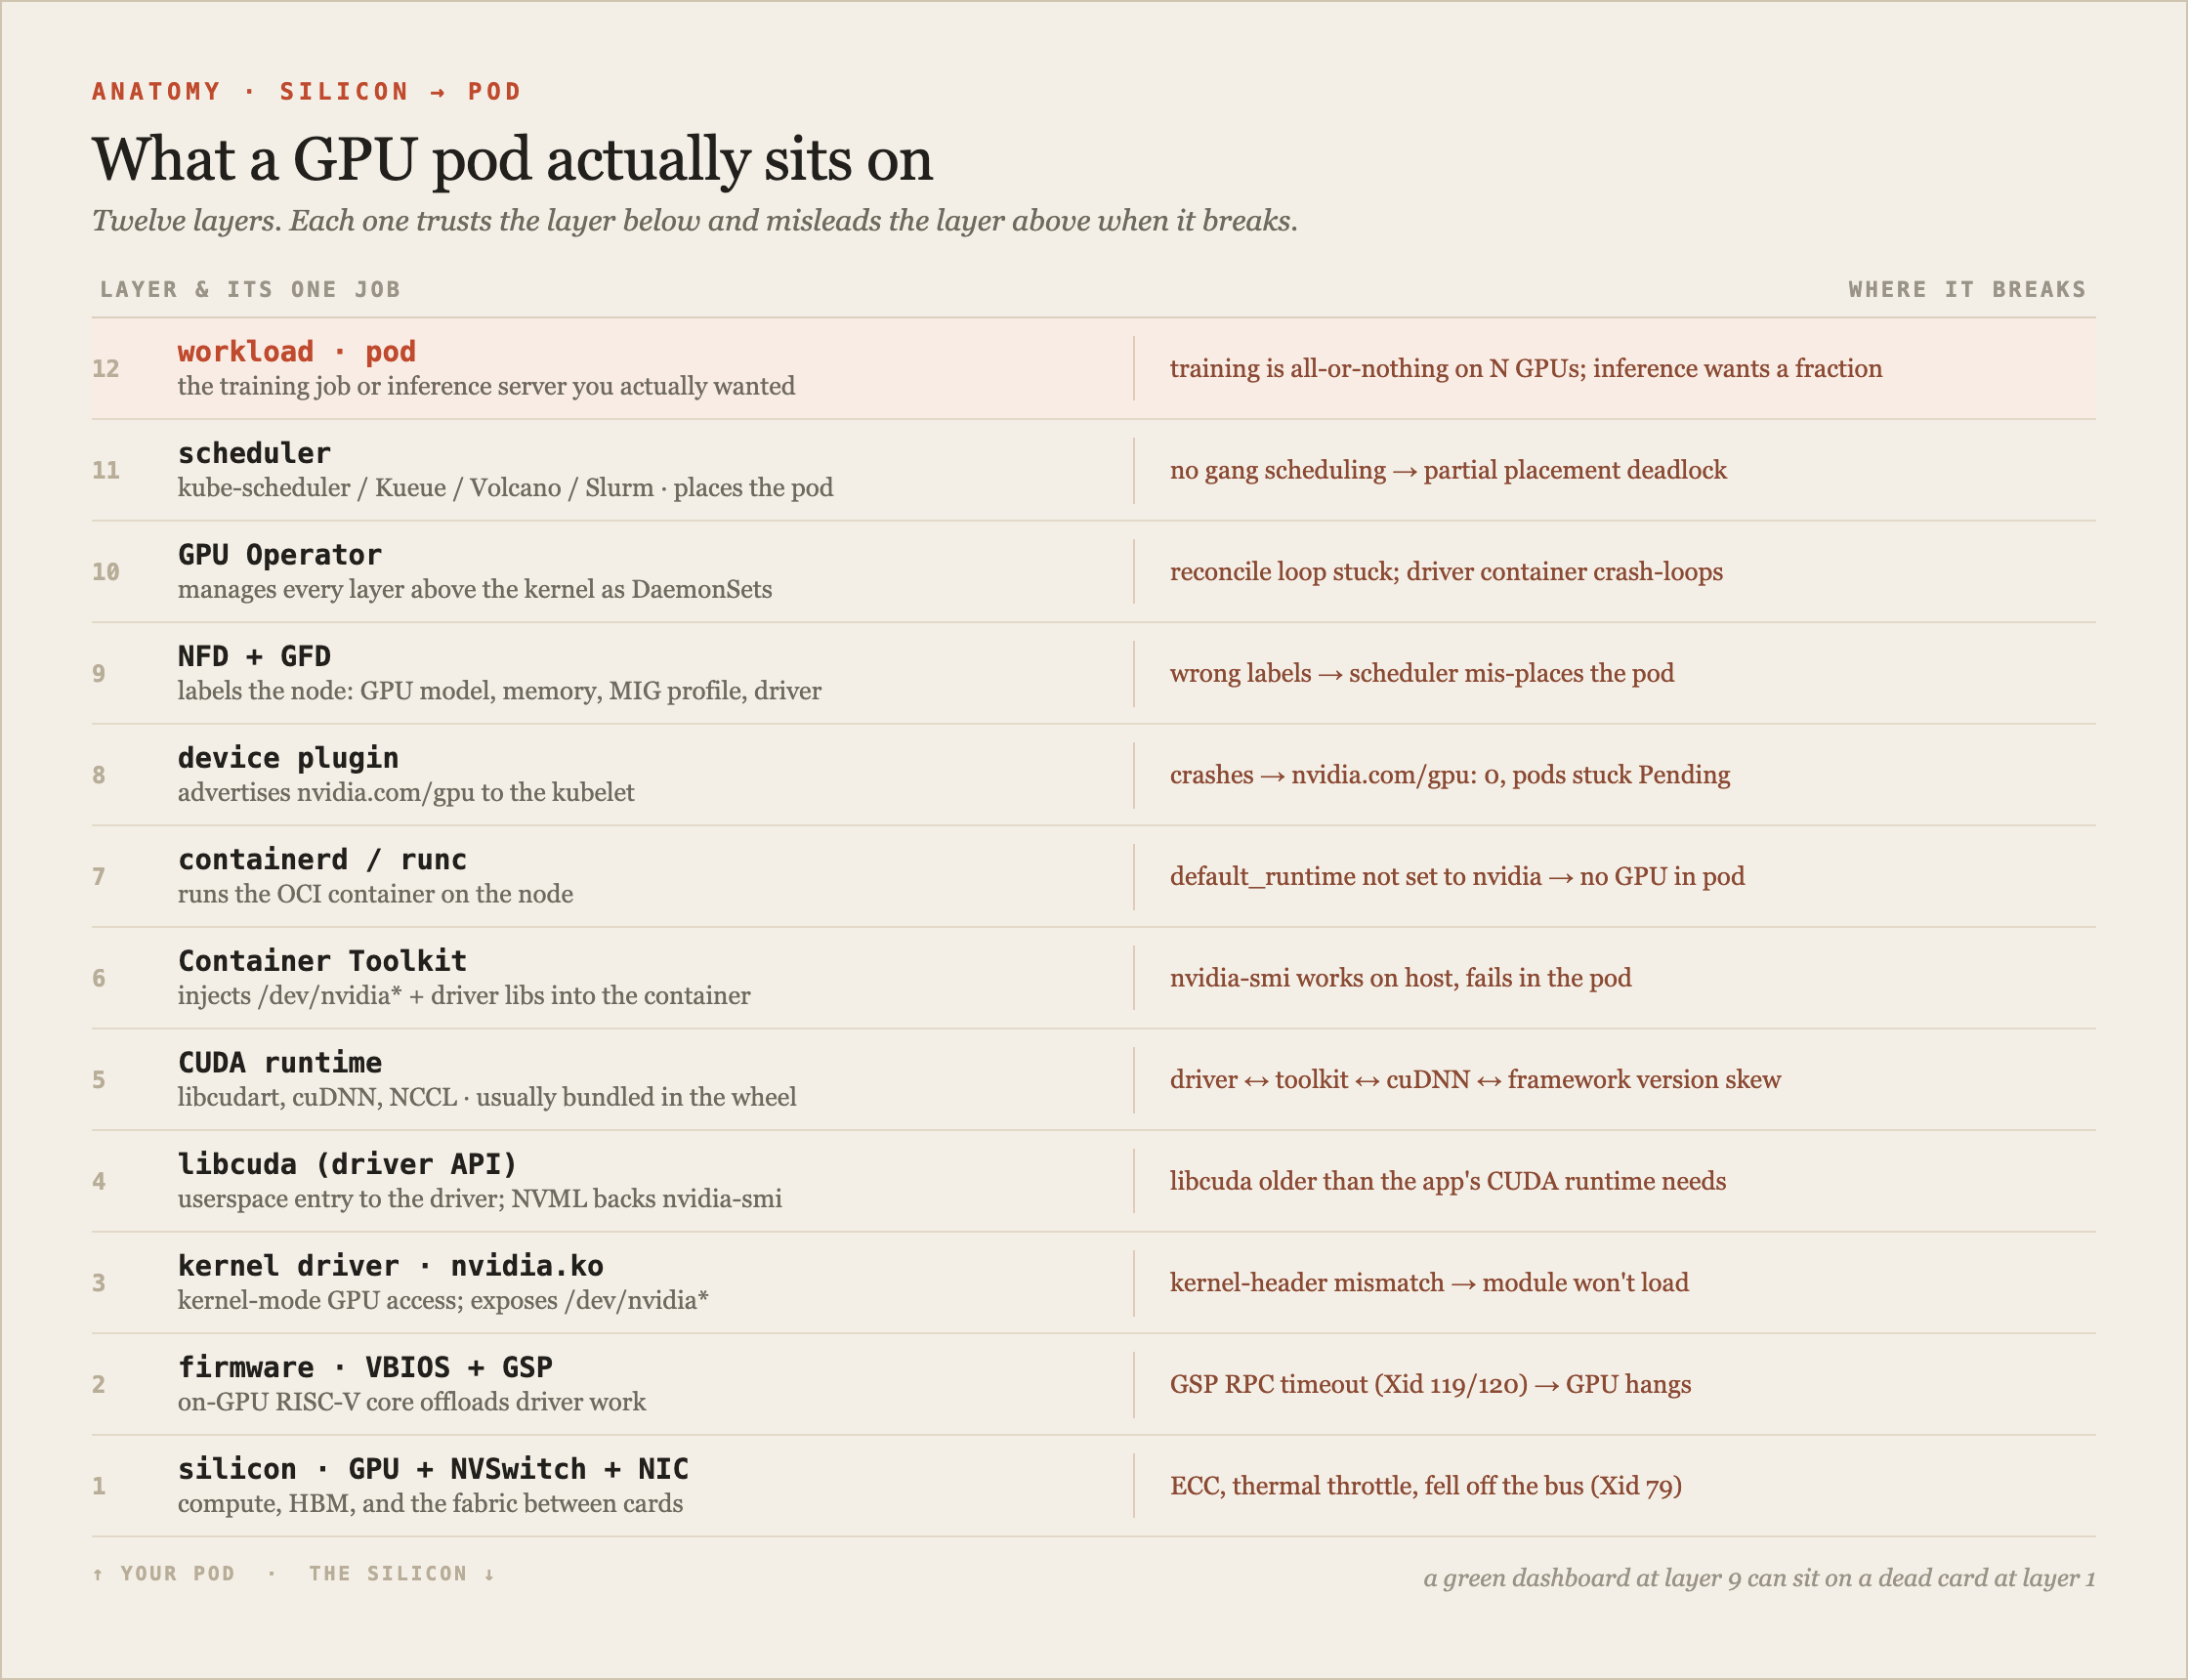
the dozen layers between silicon and your pod
Start at the bottom and climb. Each layer trusts the one under it and lies to the one above it when things go wrong.
The silicon is the GPU itself plus the NVSwitch fabric that wires the GPUs on a board together, plus the NIC (a ConnectX-7 or BlueField-3) that carries traffic off the box. This is where hardware faults live: ECC errors (bit-flips in memory the card catches and corrects), thermal throttle, a card that stops answering on the PCIe bus.
Firmware sits on the card. Modern GPUs have a GSP, a GPU System Processor, a little RISC-V core that runs firmware and offloads work the host driver used to do. When you hear about a GPU "hanging" for no visible reason, the GSP firmware timing out is a common culprit.
The kernel driver is nvidia.ko and friends (nvidia-uvm, nvidia-peermem). It's a kernel module, which means it's compiled against your exact kernel headers. Upgrade the kernel without rebuilding the module and the driver won't load. This is the layer that breaks on a Tuesday because someone patched the base image.
The userspace driver is libcuda.so, the CUDA driver API. It ships with the driver, not with CUDA, and this trips people up constantly. nvidia-smi talks to the driver through NVML, which is why nvidia-smi can work while your actual CUDA program fails: they're using different entry points into the same stack.
The CUDA runtime is libcudart plus the math and collective libraries: cuBLAS, cuDNN, NCCL. Here's the thing nobody tells you on day one. PyTorch and TensorFlow wheels bundle their own copy of all of this. When you pip install torch==2.x+cu128, you are installing CUDA 12.8, cuDNN, and NCCL inside the wheel. The host node doesn't need a CUDA install at all. It needs a driver new enough to satisfy that bundled runtime, and nothing more. Once that clicks, half the version confusion evaporates.
The NVIDIA Container Toolkit (nvidia-ctk, libnvidia-container, currently 1.19.1) is the bridge between the host driver and the container. At container start it injects /dev/nvidia* and the driver libraries into the container's filesystem. Miss this and you get the classic symptom: nvidia-smi works on the host, fails inside the pod.
The container runtime is containerd or CRI-O running runc underneath. It has to be told to use the nvidia runtime. If default_runtime_name in /etc/containerd/config.toml isn't set, pods land on the node with no GPU access and no obvious error. (Recent GPU Operator versions wire this through the NRI/CDI plugin instead of a default runtime, but the failure mode is identical: get it wrong and the pod sees no GPU.)
The device plugin (0.19.x) is the piece that talks to the kubelet. It counts the GPUs and advertises them as nvidia.com/gpu: 8, or nvidia.com/mig-1g.10gb: 56 if you're slicing. When this crashes or can't reach the driver, you get nvidia.com/gpu: 0 and pods stuck Pending. That was my incident at the top. The device plugin had crash-looped after a driver-container restart and never re-registered.
Node Feature Discovery and GPU Feature Discovery label the node with what it has: GPU model, memory, compute capability, MIG profile, driver version. The scheduler reads those labels to place pods. Wrong labels, wrong placement.
The GPU Operator (v26.3.x) is the thing that installs and manages every layer above the kernel as a set of DaemonSets. It runs the driver as a container, wires the toolkit, deploys the device plugin, DCGM, the MIG manager. It's a huge convenience and one more control loop to debug when it gets stuck reconciling.
On top, the scheduler (kube-scheduler, or Kueue, Volcano, Run:ai, or Slurm) decides which pod lands on which GPU. And finally the workload: a training job that needs all N GPUs at once or nothing, or an inference server that would happily take a seventh of one card.
Twelve layers. The reason GPU infra feels harder than normal infra isn't any single layer. It's that the failure at layer 3 shows up as a symptom at layer 9, and the tooling at layer 9 has no idea layer 3 exists.
Key Insight: The layer that breaks and the symptom you notice are rarely the same layer. The pod is Pending up at the scheduler, but the cause is a driver that didn't load down near the metal. When a GPU pod misbehaves, debug from the bottom of the stack up, not the top down.
One part of this stack is quietly being rebuilt under you. The device plugin advertising nvidia.com/gpu: 8 is a flat count: a pod asks for a number and gets whatever GPUs the node has. Kubernetes 1.34 (September 2025) made Dynamic Resource Allocation (DRA) generally available, and it's the eventual replacement for that model. DRA is a ResourceClaim API, the way a PersistentVolumeClaim is for storage, so a pod can ask for "two NVLink-connected GPUs with at least 40GB each" instead of a bare count, and it's how rack-scale multi-node NVLink (GB200 NVL72) gets scheduled at all. NVIDIA ships a DRA driver through the GPU Operator. The device plugin is still the common path in mid-2026, but a stack diagram drawn today should treat it as the model DRA is replacing, not the permanent one.
the version matrix that pages you
The single most common self-inflicted outage is a version mismatch, and the matrix has four axes: driver, CUDA toolkit, cuDNN, and framework. The good news is that three compatibility mechanisms mean you rarely have to line up all four exactly. The bad news is that nobody explains which mechanism they're relying on, so it feels like luck.
Backward compatibility is the easy one. A newer driver runs older CUDA binaries, always. An R580 driver runs a CUDA 12 app and a CUDA 13 app without complaint. So keeping the driver ahead of everything is safe.
CUDA minor-version compatibility is the one you lean on daily. Any CUDA 12.x toolkit runs on any driver that supports 12.0. A driver from the 525 era will run a CUDA 12.8 binary, because they share the CUDA 12 major. This is why the framework-bundles-its-own-CUDA pattern works: the wheel carries CUDA 12.8, your node has some 12-capable driver, and they meet in the middle.
Forward compatibility is the escape hatch. The cuda-compat package ships updated libcuda stubs that let a newer CUDA major run on an older driver branch. It's how you run a CUDA 13 app on a node still pinned to an R535 driver you can't upgrade yet. It only works on data-center GPUs, and it's a deliberate override, not something to build on.
Here's the current data-center driver picture as of mid-2026:
| Branch | Type | EOL | CUDA |
|---|---|---|---|
| R535 | LTS | June 2026 | 12 |
| R580 | LTS | June 2028 | 13 |
| R595 | Production | March 2027 | 13 |
| R610 | New Feature | Aug 2026 | 13 |
If you take one thing from this section: manage the driver, let the framework carry the rest. Pin your training and serving images to NGC base images (nvcr.io/nvidia/pytorch:25.xx) where NVIDIA has already matched CUDA, cuDNN, and NCCL for you, and you delete an entire class of 2am pages.
One current gotcha worth flagging if you're on Blackwell. Drivers from 580.65.06 turn on Coherent Driver Memory Management by default for GB200 and GH200 on Kubernetes, and CDMM is incompatible with both MIG and GPUDirect Storage right now. If you buy GB200s planning to slice them with MIG, check that first, because it's not going to be on the datasheet.
slicing one GPU three ways
A single H100 has 80GB of HBM (its fast on-board memory) and enough compute to serve dozens of small models. Handing a whole card to a workload that uses 8% of it is how you set money on fire. There are three ways to share a GPU, and they are not interchangeable. The difference is isolation.
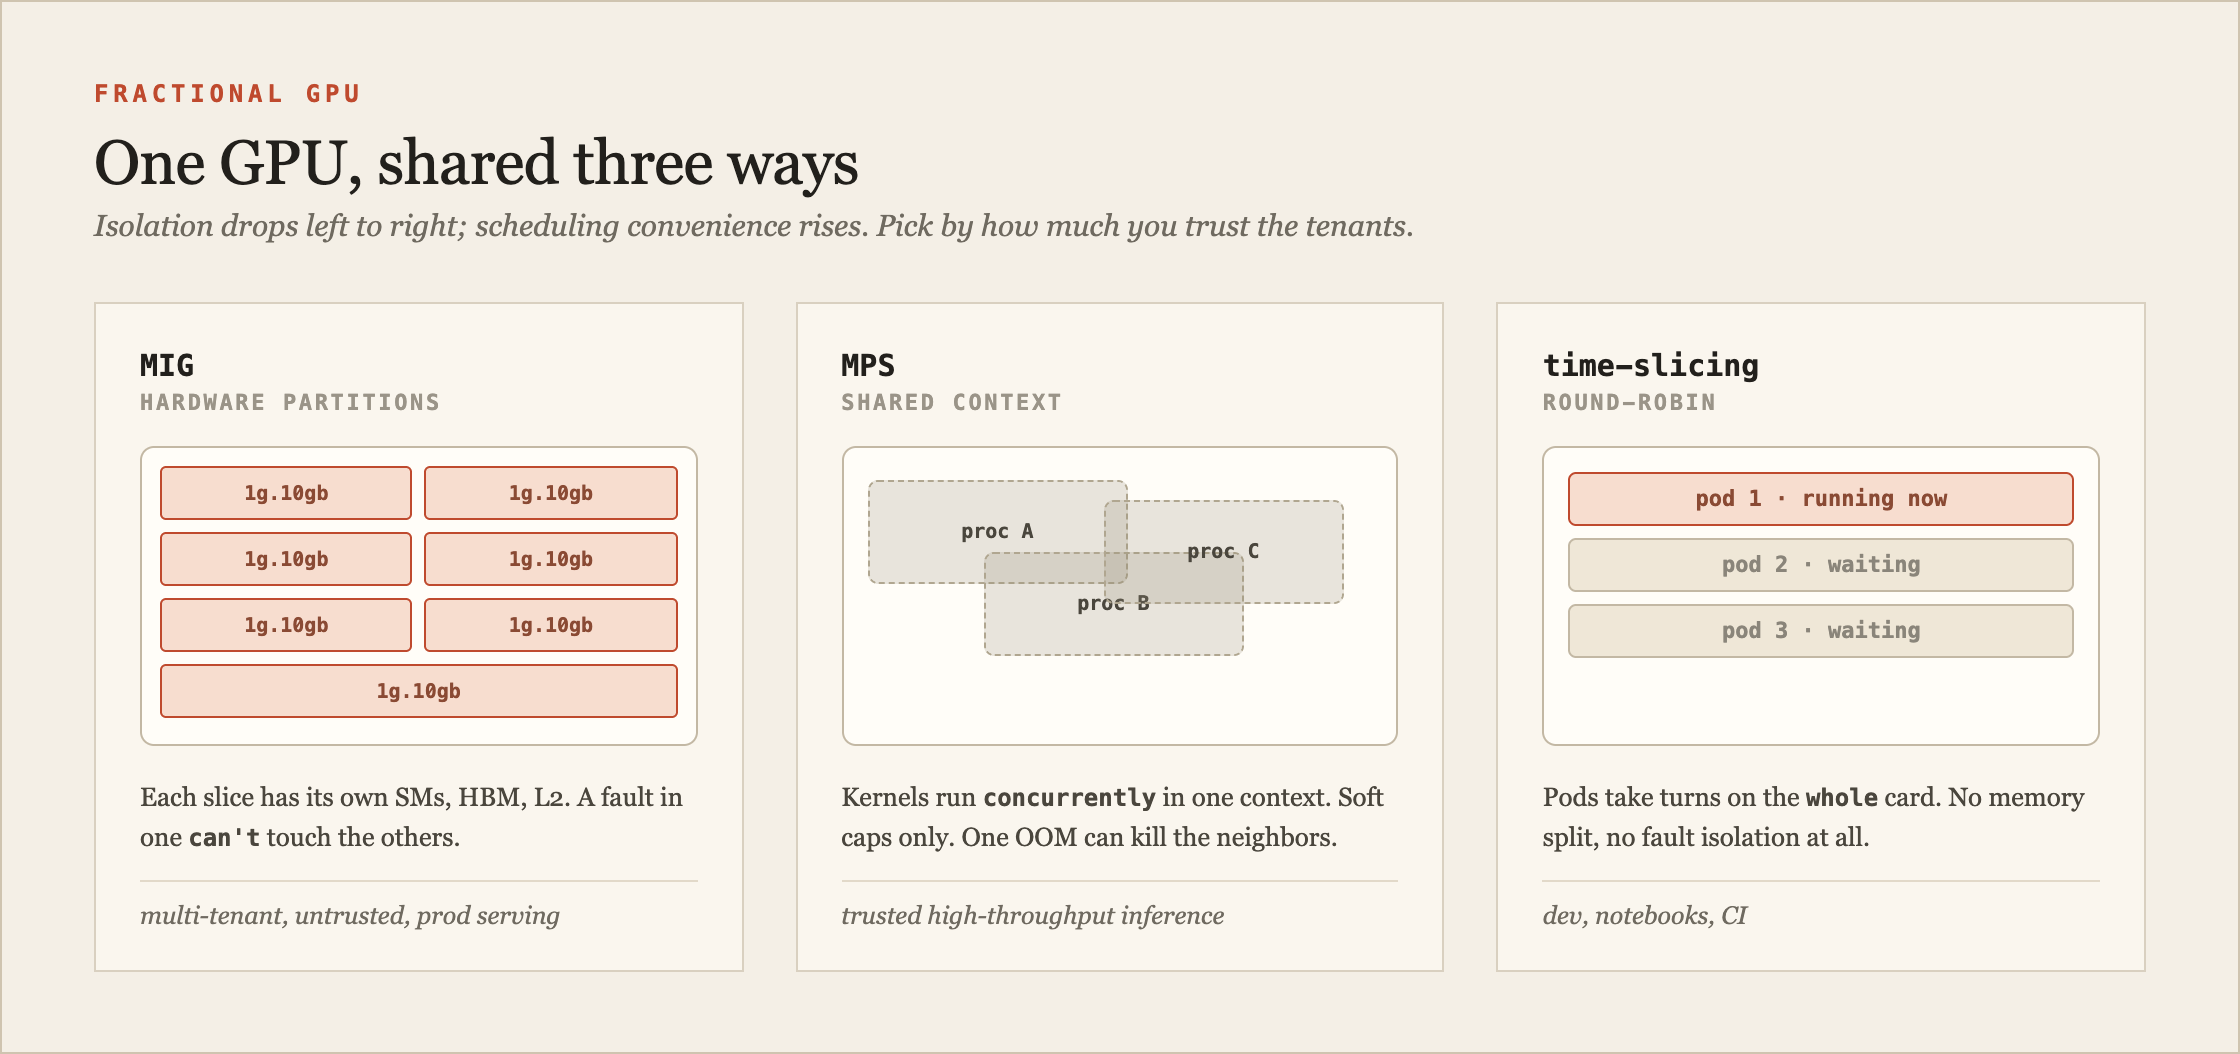
Fig. 2 · the same GPU shared three ways. Isolation drops as you move right; utilization convenience goes up. Pick by how much you trust the tenants.
MIG (Multi-Instance GPU) is hardware partitioning, available on the data-center cards (A100, A30, H100, H200, B200) but not the smaller inference GPUs like the L4 or A10G, which fall back to MPS. It cuts one GPU into up to seven instances, each with its own SMs (the GPU's compute cores), its own dedicated slice of HBM, its own memory controller and L2. A fault in one instance doesn't touch the others. That's real hardware isolation, the kind you want when tenants don't trust each other. The profiles are named [compute]g.[memory]gb. On an H100 80GB you get seven 1g.10gb slices, or two 3g.40gb, or one 7g.80gb that's just the whole card back. An H200's 141GB gives you seven 1g.18gb slices; a B200's 180GB gives seven 1g.23gb. The quirk that catches everyone: compute fractions go 1/7, 2/7, 3/7, 4/7, 7/7. There is no 5g or 6g profile. Memory is quantized in eighths. So a 1g slice gets one-seventh of the compute but one-eighth of the memory, and the arithmetic never quite lines up.
MPS (Multi-Process Service) is a daemon that multiplexes several processes into one GPU context so their kernels run genuinely concurrently, not round-robin. You can cap each client's memory (CUDA_MPS_PINNED_DEVICE_MEM_LIMIT) and compute share (CUDA_MPS_ACTIVE_THREAD_PERCENTAGE). What you don't get is hardware memory protection or clean fault isolation. One client that OOMs can take its neighbors down with it. MPS is for high-throughput inference where you own all the tenants and want better SM utilization than time-slicing gives you.
Time-slicing is the crude one. The device plugin just lies about the GPU count, advertising one physical card as ten replicas. Ten pods land, and they take turns via context switching. There is no memory partitioning and no fault isolation at all. If one pod grabs 70GB of an 80GB card, the other nine OOM. It's fine for notebooks, CI, and dev clusters where the work is bursty and nobody's SLA depends on it. It has no business in front of production traffic.
| Memory isolation | Fault isolation | Concurrency | Use for | |
|---|---|---|---|---|
| MIG | hardware | hardware | spatial | multi-tenant, untrusted, prod serving |
| MPS | soft caps | weak | true concurrent | trusted high-throughput inference |
| Time-slicing | none | none | round-robin | dev, notebooks, CI |
You can stack them: partition a card into seven MIG slices, then time-slice each slice for burstier workloads. Most teams don't need that. Most teams need to notice they're running one 8% workload per $30k card and switch to 7× 1g.10gb.
the metrics that lie to you
Here's the number that ruins more capacity planning than any other: GPU-Util. When nvidia-smi shows 95% and everyone relaxes, they've misread it. DCGM_FI_DEV_GPU_UTIL answers exactly one question: was a kernel running during the sample window. It says nothing about how much of the silicon that kernel used. You can see 95% GPU utilization and 25% of the actual compute capacity in use at the same moment, and both numbers are honest about different things. Somebody will still screenshot the 95% into a capacity deck, and now you're being asked to buy more of a card you're already wasting.
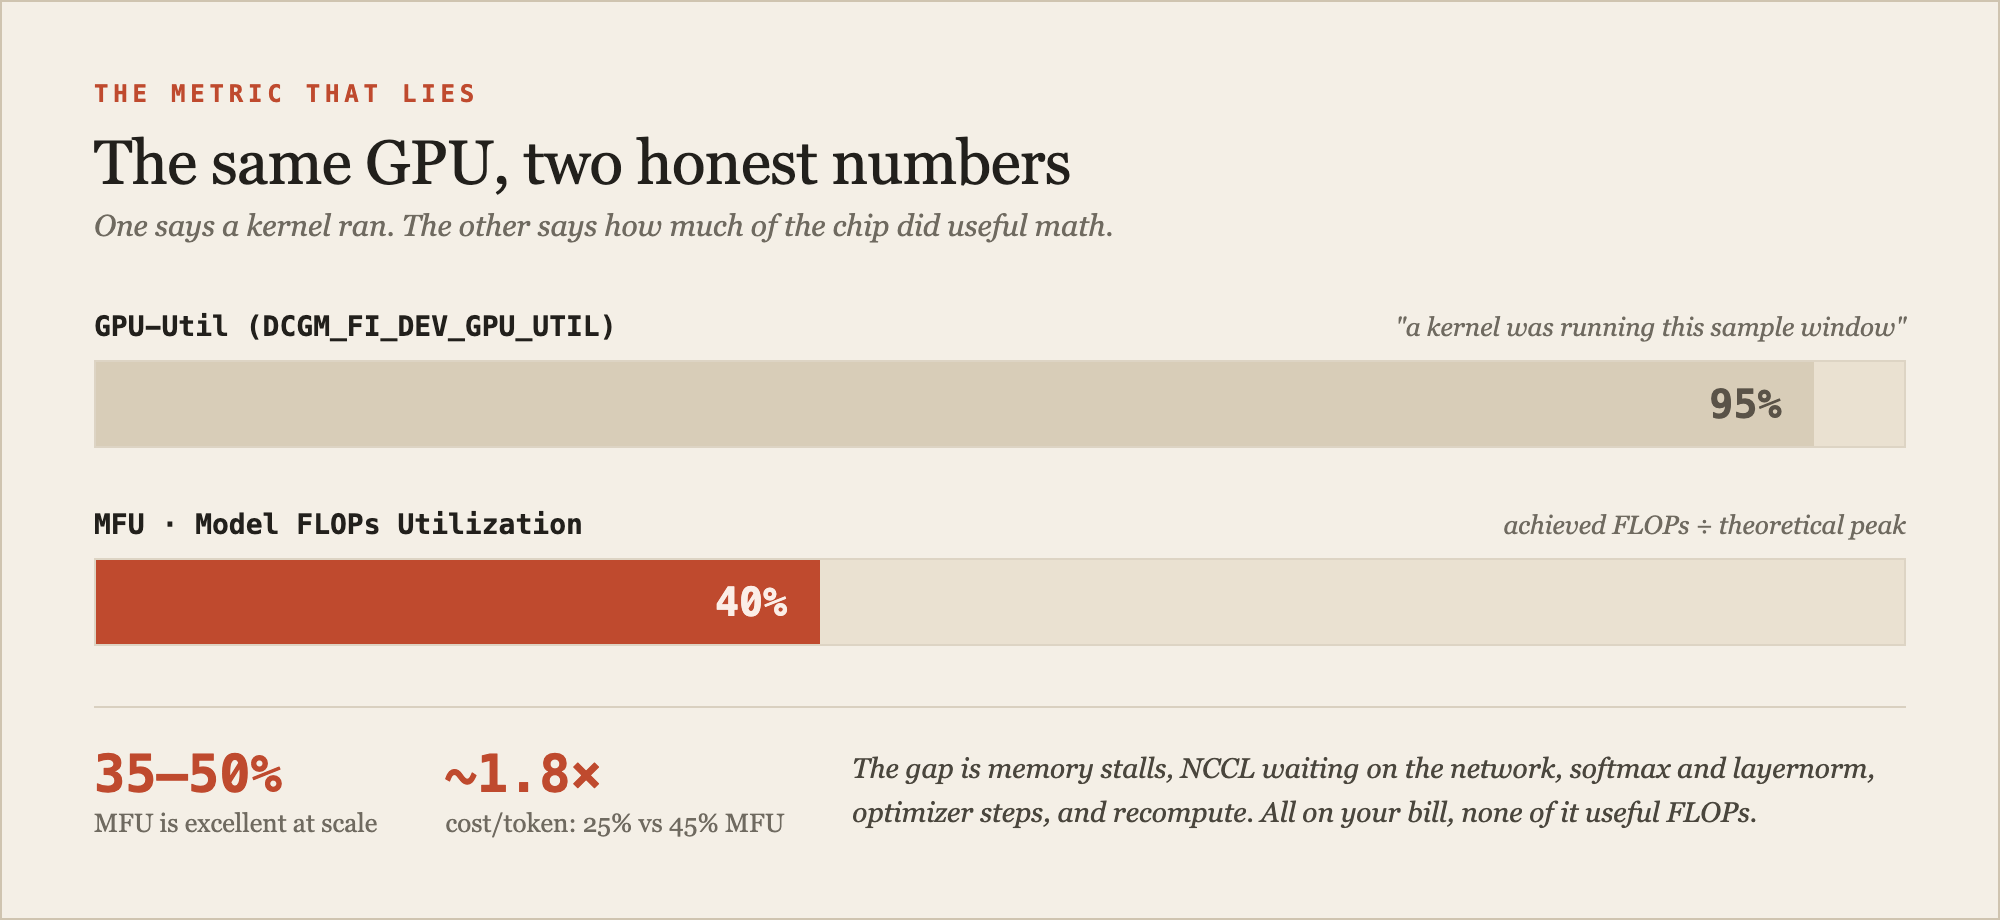
Fig. 3 · GPU-Util says a kernel ran. MFU says how much of the chip did useful work. The gap between them is memory stalls, collective communication, and non-matmul overhead you paid for anyway.
The number that matters for training is MFU, Model FLOPs Utilization: the FLOPs your model actually did divided by the theoretical peak. It's the metric the Llama and PaLM papers report, and 35–50% is considered excellent for large-scale training. The gap between "a kernel ran" and "the chip did useful math" is memory-bandwidth stalls, NCCL all-reduce waiting on the network, attention softmax and layernorm that aren't matmuls, optimizer steps, and activation recompute. All of it counts against your wall clock. None of it counts as useful FLOPs.
The money follows directly. On an 8-GPU H100 node at roughly $3 per GPU-hour, the difference between 25% and 45% MFU is about 1.8× the effective cost per token. Sticker price per GPU-hour is the number vendors compete on. Utilization is the number that actually sets your bill.
For real telemetry, DCGM (Data Center GPU Manager) is the layer, and dcgm-exporter scrapes it into Prometheus. The fields worth putting on a dashboard from day one:
DCGM_FI_PROF_PIPE_TENSOR_ACTIVE: Tensor Core utilization, the one that tracks real training throughput.DCGM_FI_PROF_DRAM_ACTIVE: HBM bandwidth in use. High here with low tensor activity means you're memory-bound.DCGM_FI_DEV_FB_USED: HBM used. Your OOM early-warning.DCGM_FI_DEV_XID_ERRORS: the last Xid code. The single most important reliability signal on the box.DCGM_FI_DEV_ECC_DBE_VOLand the row-remap fields: memory health, trending toward RMA.DCGM_FI_DEV_CLOCK_THROTTLE_REASONS: a bitmask telling you whether the card is throttling on power, thermals, or a reliability limit.
dcgmi diag -r 3 runs about twelve minutes of escalating health checks (memory bandwidth, PCIe, NVLink, thermals under load) and is the thing to run before you trust a node you just recovered.
the Xid codes worth memorizing
Xid errors are the driver's way of telling the kernel log that the hardware had to correct or retry something it shouldn't have. They land in dmesg as NVRM: Xid (PCI:0000:xx:00): <code>. A nonzero Xid is not always fatal, but it's never nothing. A handful are worth knowing on sight because they change what you do next.
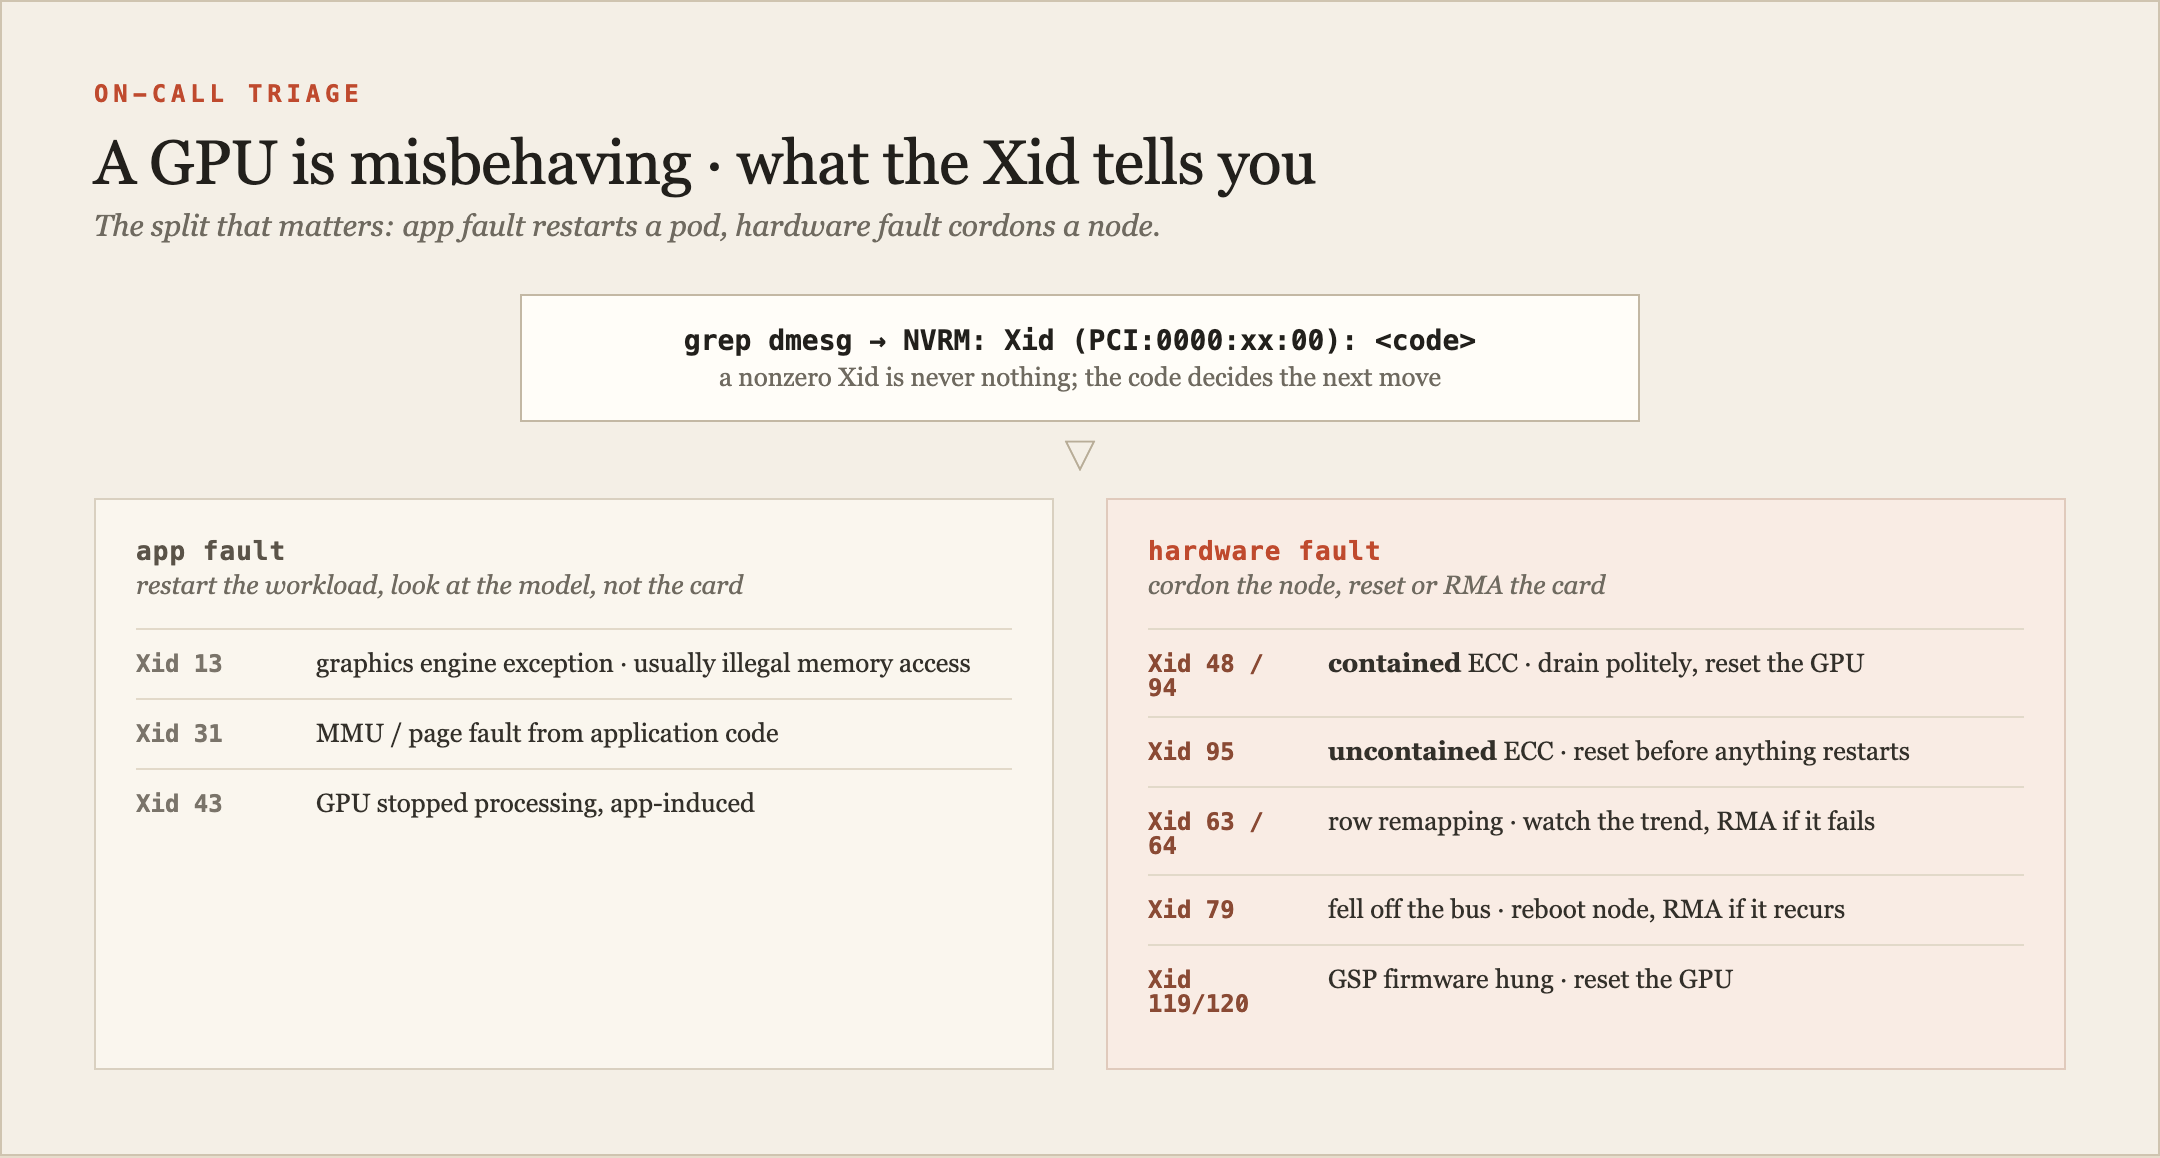
Fig. 4 · the Xid triage most on-call runbooks converge on. The split that matters is app-fault versus hardware-fault, because one restarts a pod and the other cordons a node.
Xid 13, 31, 43 are usually your fault, not the hardware's: illegal memory access, a bad kernel, a page fault from application code. Restart the workload, look at the model, not the card.
Xid 48 is a double-bit ECC error, uncorrectable. Xid 94 is a contained ECC error, where the damage stayed inside the offending app and the other apps on the card survived. Xid 95 is the uncontained version, where the blast radius crossed apps, and the GPU has to be reset before anything restarts on it. The 94/95 split is the one to internalize: contained means drain politely, uncontained means the card is compromised until reset.
Xid 63 and 64 are row-remapping events. Modern HBM can retire bad memory rows the way a disk retires bad sectors. A 63 is the card recording that it did this; persistent 64s (remap failures) mean it's running out of spare rows and it's an RMA candidate. Watch the trend, don't panic on the first one.
Xid 79 is the one that ruins a night: "GPU has fallen off the bus." The card stopped answering on PCIe entirely. Thermal, power delivery, seating, a dying board. The node needs a reset, and if the same physical slot throws it again, that's a card headed back for RMA. Field reports put it around 3% of H100 deployments in the first year, which sounds small until you multiply it by a thousand-GPU fleet.
Xid 119 and 120 are the GSP firmware timing out. Reset the GPU. On a few driver versions it's common enough that ops teams disable the GSP firmware as a workaround, which tells you how much fun that particular bug is.
The remediation ladder most teams settle on is boring and effective: app restart or driver reload or node reboot clears roughly 60% of incidents within fifteen minutes; anything that survives that gets dcgmi diag -r 3; anything that fails the diag gets cordoned and sent back.
what to actually care about
If you're standing up GPU infrastructure and wondering where to spend your attention, the honest ranking isn't the one the marketing implies. It's roughly this. Get the driver-and-toolkit layer boringly stable, because that's where the self-inflicted outages live. Instrument MFU and the Xid stream before you instrument anything pretty, because those two tell you whether you're wasting money and whether the hardware is dying. Decide your sharing model (MIG for multi-tenant, whole cards for training) before you have tenants, because retrofitting isolation is miserable. And treat the twelve-layer stack as the thing it is: a place where a green dashboard at layer 9 can sit directly on top of a card that fell off the bus at layer 1.
The pod that was stuck Pending at the top of this post came back the moment the device plugin re-registered. Fifteen seconds of fix, forty minutes of staring at a healthy nvidia-smi wondering how the machine could see eight GPUs that Kubernetes swore didn't exist. That distance, between what the hardware knows and what the scheduler believes, is where most of your on-call rotation lives too. The next part goes inside a single box with eight of these cards and the wires that decide whether they cooperate or just sit next to each other.