On 500 GB of logs over 7 days, on the same hardware: 94% lower query latencies, 37% smaller storage, and under half the CPU and RAM. The single number that surprised us most was the 12× drop in needle-in-a-haystack search times.
the setup
At Truefoundry we run multi-tenant ML workloads on Kubernetes. The log layer has to deliver fast ad-hoc search across mixed namespaces (often with no good labels to anchor on), sustained 60+ MB/s ingestion during deploys and incidents, and live tailing that doesn't fall behind during a noisy crash loop. It also has to run as a single binary (we don't want a six-component log stack) within a 4 vCPU / 16 GiB node ceiling shared with everything else.
Loki was our default. Past the 1M-active-series mark it started showing 30s+ search latencies and high I/O amplification. So we benchmarked it head-to-head against VictoriaLogs and let the numbers decide.
the contestants
- Loki: Grafana Labs' log store. Compressed chunks, label-based indexing, LogQL. Brilliant Grafana integration; expensive regex scans and Go GC overhead at scale.
- VictoriaLogs: VictoriaMetrics' columnar LSM log database. Per-field indices, SIMD search, LogsQL. Single binary, low memory footprint, efficient compression.
benchmark methodology
| Category | Details |
|---|---|
| Hardware | 4 vCPU / 8 GiB RAM, identical for both, QoS: Guaranteed |
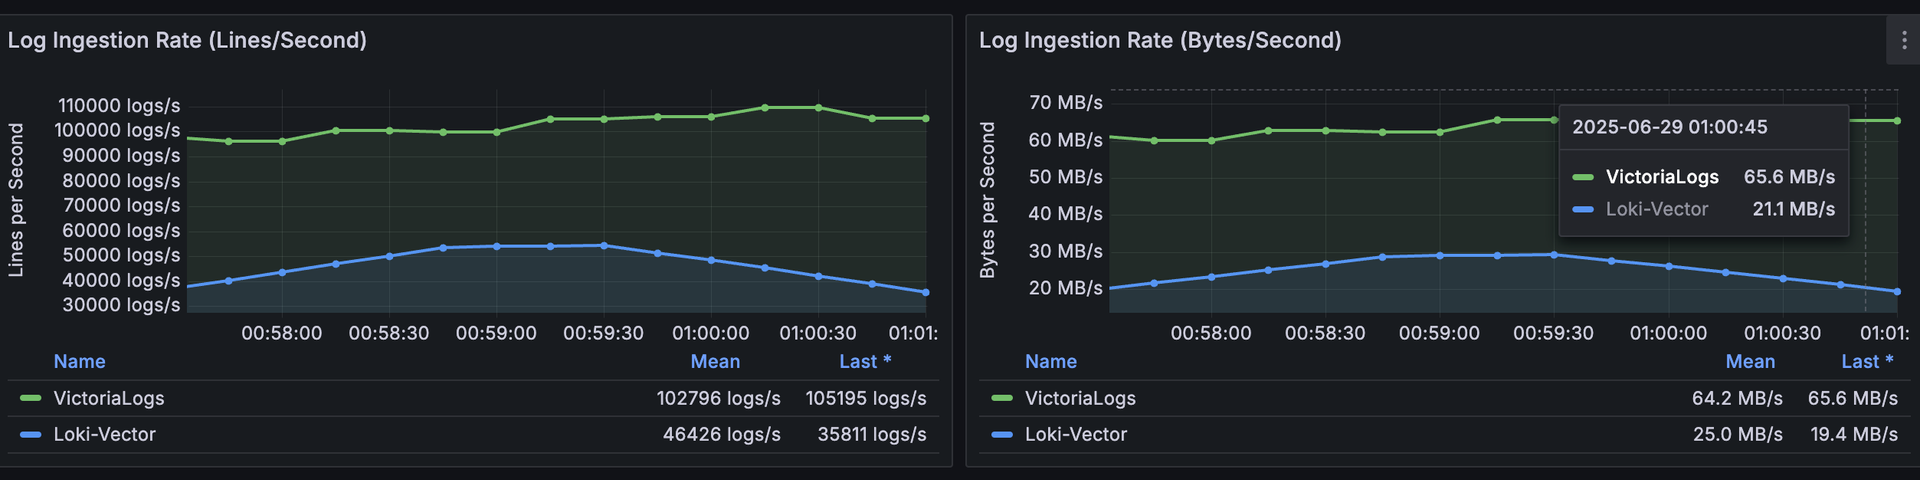
| Log generator | flog → Vector → Loki / VictoriaLogs at 65 MB/s sustained |
| Dataset | ~500 GB over 7 days; mix of unique and duplicated lines across 20 namespaces, 40 apps |
| Retention | 7 days |
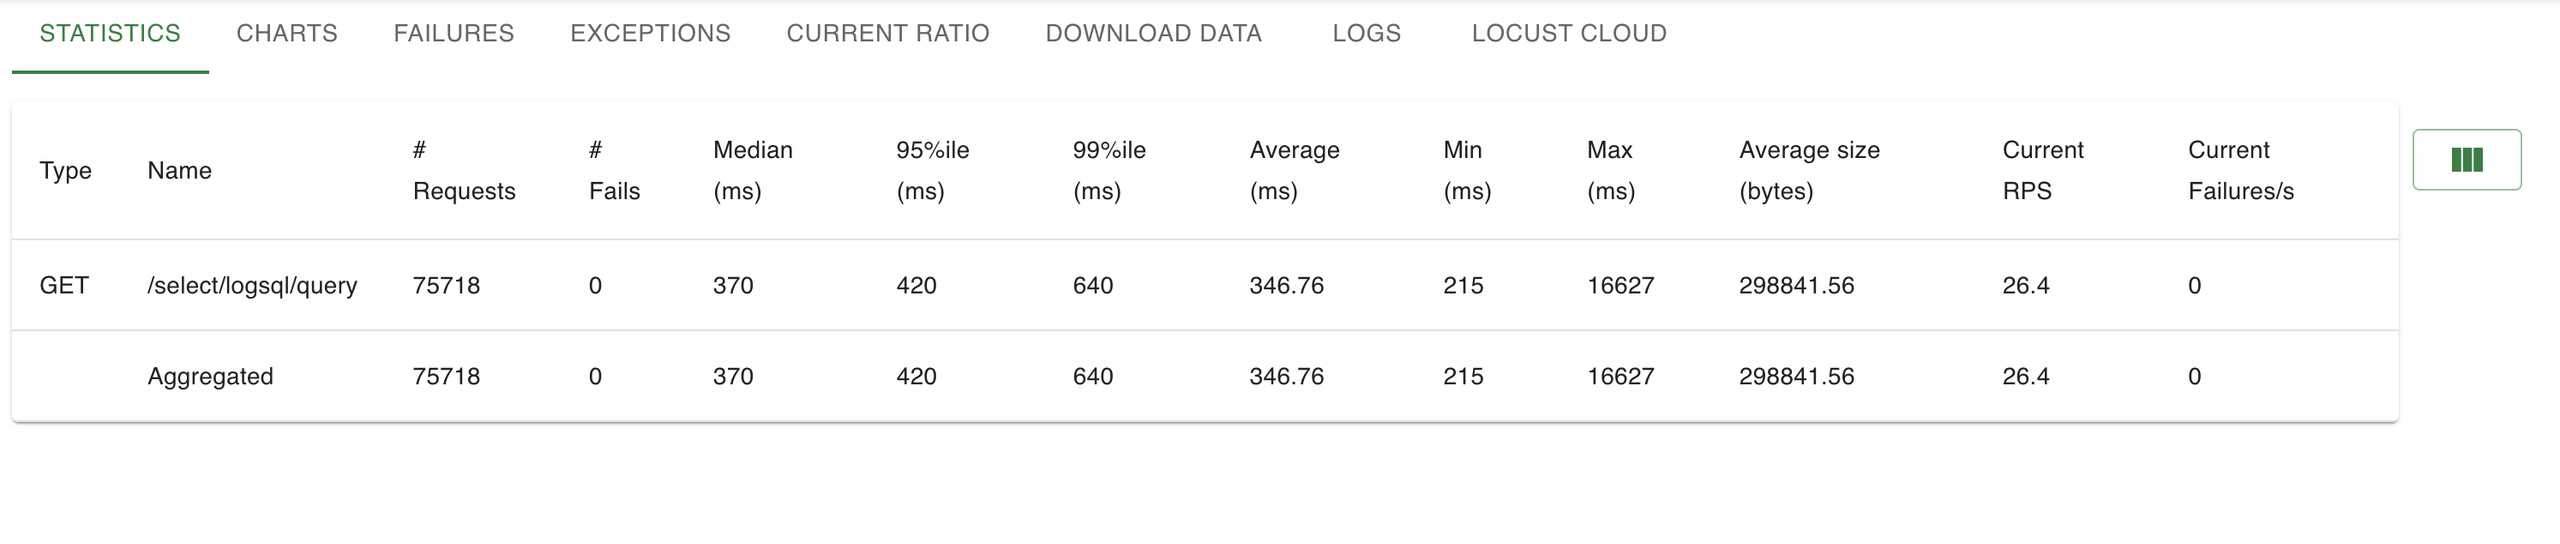
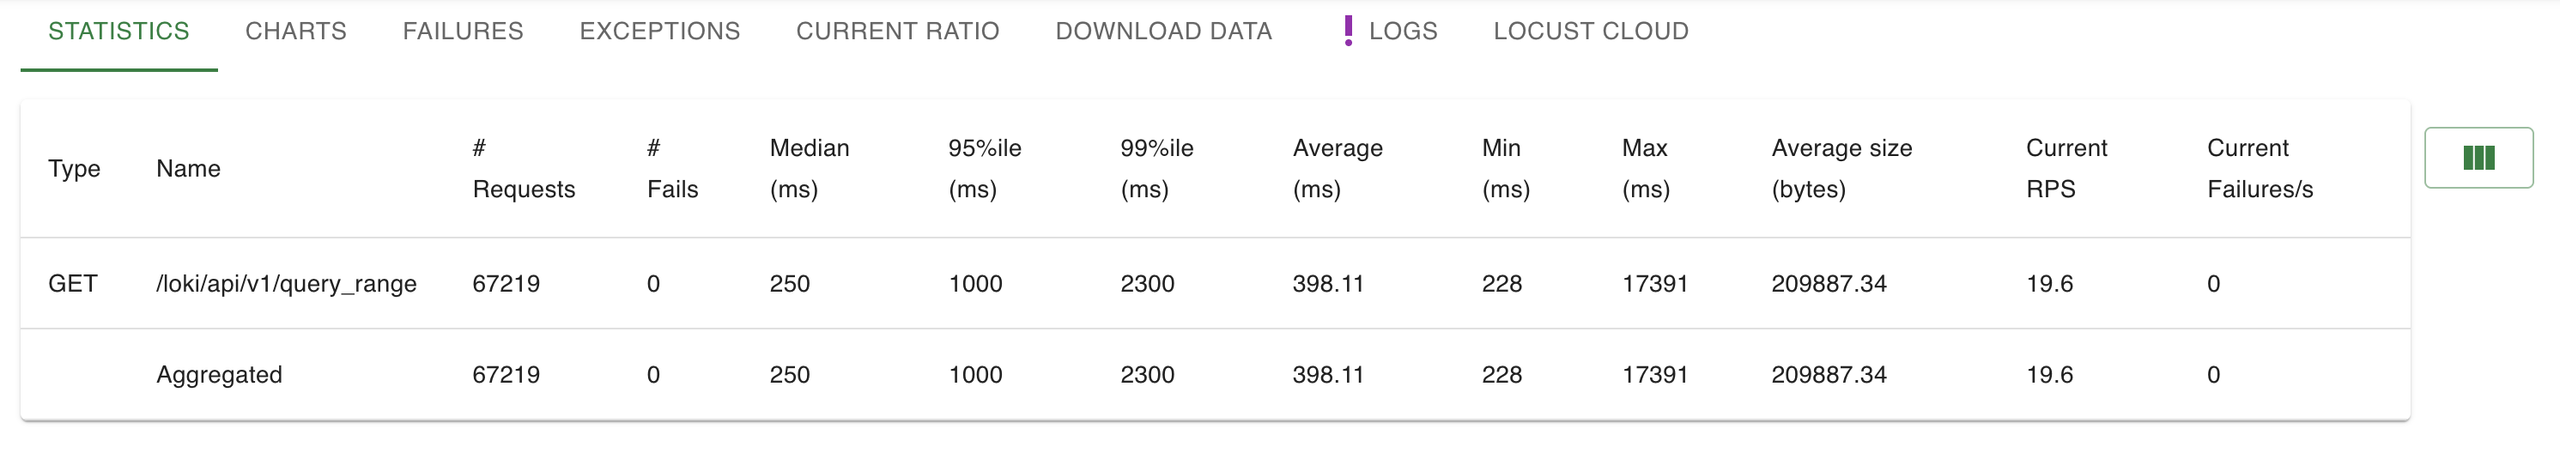
| Load test | Locust 2.27.1, 10 virtual users, sustained 43 RPS via /select/logsql/query and the Grafana datasource |
| Queries | Stats, Needle in a Haystack, Negative (detailed below) |
| Caching | Block cache disabled on both; pods restarted before each run to simulate cold reads |
| Index tweaks | Defaults on both |
the headline figure
Before the methodology debate, here's what the seven days produced.
The Grafana panels behind those numbers use the same six metrics for both systems, two very different shapes:
Loki:

VictoriaLogs:
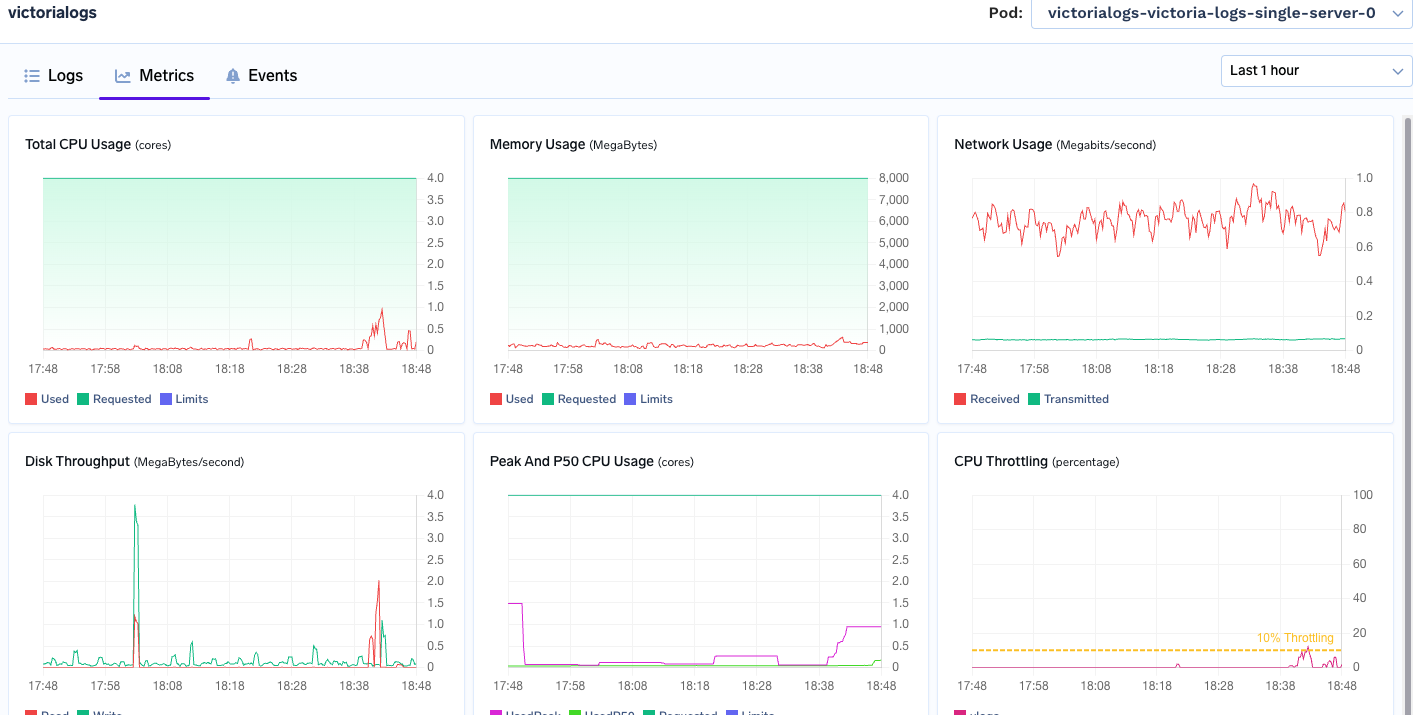
The memory line is the one that most directly translates into infrastructure cost. At steady state, VictoriaLogs sat around 1.3 GB while Loki held 6–7 GB. Freeing ~5 GB per node is the difference between bin-packing four tenants on a box and seven.
storage on disk
Same logs, same 7-day retention, identical ingestion path. Loki landed at 501 GB; VictoriaLogs at 318 GB, 37% smaller with no tuning on either side.
The difference is partly the codec (VictoriaLogs uses zstd, Loki defaults to snappy) but mostly the layout. Columnar storage finds redundancy that stream-chunked LSMs don't see; values from the same field compress together far better than values stitched in by line order.
At fleet scale this is a 1 TB volume holding what used to need 1.5 TB.
query performance
Three query patterns, run against the same 500 GB / 7-day index. Result sets were verified to be identical between the two systems.
1. stats: log count over 24 hours
Purpose: Total log lines from app="servicefoundry-server".
- LogQL:
sum(count_over_time({app="servicefoundry-server"}[24h])) - LogsQL:
{app="servicefoundry-server"} | stats count()
| System | Latency |
|---|---|
| Loki | 2.5s |
| VictoriaLogs | 1.5s |
Aggregate counts hit Loki's strength (label-anchored, no text scan) and Loki still loses by 40% on the wall clock. VictoriaLogs holds its own on label queries; Loki has no answer for the others.
2. needle in a haystack: finding one line in 500 GB
Purpose: Locate a single static log entry [UNIQUE-STATIC-LOG] ID=abc123 XYZ in the truefoundry namespace over 7 days.
- LogQL:
{namespace="truefoundry", app!="grafana"} |= "[UNIQUE-STATIC-LOG] ID=abc123 XYZ" - LogsQL:
{namespace="truefoundry", app!="grafana"} "[UNIQUE-STATIC-LOG] ID=abc123 XYZ"
| System | Latency |
|---|---|
| Loki | 12s |
| VictoriaLogs | ~900ms |
The single-character difference in syntax (|= vs nothing) hides the architectural one. Loki's |= is a substring filter run line-by-line over decompressed chunks. VictoriaLogs treats the same string as an index probe. 12 seconds turns into 900 milliseconds on identical hardware.
3. negative: proving a string doesn't exist
Purpose: Search for a string that doesn't appear anywhere in the dataset. Forces a full scan in both systems.
- LogQL:
{namespace="truefoundry"} |= "non-existent log line" - LogsQL:
{namespace="truefoundry"} "non-existent log line"
| Dataset | Loki | VictoriaLogs |
|---|---|---|
| 500 GB | Timeout | 2.2s |
| 300 GB | 2.6s | 266ms |
The negative query is the quiet one. At 300 GB Loki handles it in 2.6 seconds. At 500 GB the resources choke and the query halts and never returns. In production that's the difference between an alert that fires and a dashboard that loads.
ingestion under pressure
We pushed both with 120 flog replicas to find the ceiling.
| Metric | Loki | VictoriaLogs | Delta |
|---|---|---|---|
| Peak ingestion | 20 MB/s | 66 MB/s | 3× higher |
| vCPU (sustained) | 4 vCPU, 100% throttled | 2 vCPU peak | 50% lower |
| Memory | ~4 GiB | ~1.3 GiB | 3× lower |

Loki hit the CPU wall first and never recovered, pinned at 100% throttled while still topping out at 20 MB/s. VictoriaLogs absorbed the same firehose at 3× the throughput, on 72% less CPU and 87% less memory.
load test under traffic
Locust, 10 concurrent users, simulating real read traffic. VictoriaLogs handled 36% more requests per second, p99 latency was 3.6× faster than Loki under load, and tail latency stayed lower at every percentile we measured.
why the gap is this big
Four design choices doing most of the work:
- Full-text indexing. Per-token indices skip line-by-line filtering entirely.
- Columnar LSM layout. Reads touch only the columns the query asks for; fewer disk seeks.
- Memory discipline. Lower steady-state overhead means more headroom for everything else.
- SIMD search. Vectorised inner loops on commodity CPUs add up over billions of lines.
when to pick which
VictoriaLogs is the right pick when text search and grep-style queries are the primary workload, when ad-hoc exploration across large windows matters, when resource efficiency and bin-packing density are real constraints, or when you want fewer knobs to tune in production.
Loki is the right pick when label-based queries dominate and full-text is rare, when deep Grafana ecosystem integration is non-negotiable, or when you already operate Loki at scale and the migration cost outweighs the wins.
For us, on this workload, the resource economics decided it. The freed memory per node became real infrastructure savings within a quarter. 12 seconds turned into 900 milliseconds with no tuning, and that's the number I keep quoting six months later.